2.2 Dielectric antenna
After loading (File-Open) the ..Antennas/Ant3/ant3.pro file into QW-Editor, we obtain the views of the dielectric antenna, as shown in Fig. 2.2-1. Pressing the Start ![]() button in the Simulation tab, exports the data, opens QW‑Simulator, and starts the FDTD analysis. Successive operations of the software are reported in the Simulator Log window, as shown in Fig. 2.2-2.
button in the Simulation tab, exports the data, opens QW‑Simulator, and starts the FDTD analysis. Successive operations of the software are reported in the Simulator Log window, as shown in Fig. 2.2-2.
Invoke Results window for S-parameters results in Cartesian coordinates by pressing ![]() button in the Results tab of QW-Simulator. It is recommended to suspend (Suspend
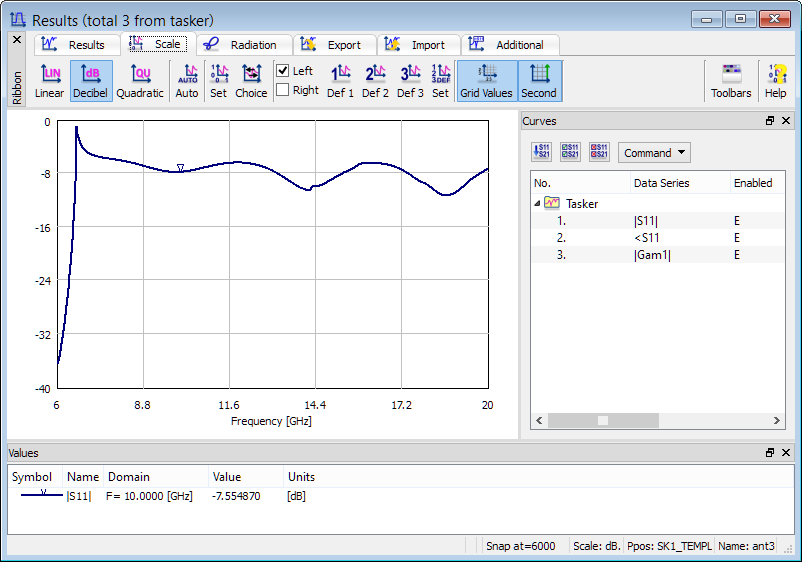
button in the Results tab of QW-Simulator. It is recommended to suspend (Suspend ![]() button in Run tab) the analysis after 6000 iterations to get stable and convergent results. After refreshing the display by pressing keyboard space), the results will be as in Fig. 2.2-3.
button in Run tab) the analysis after 6000 iterations to get stable and convergent results. After refreshing the display by pressing keyboard space), the results will be as in Fig. 2.2-3.
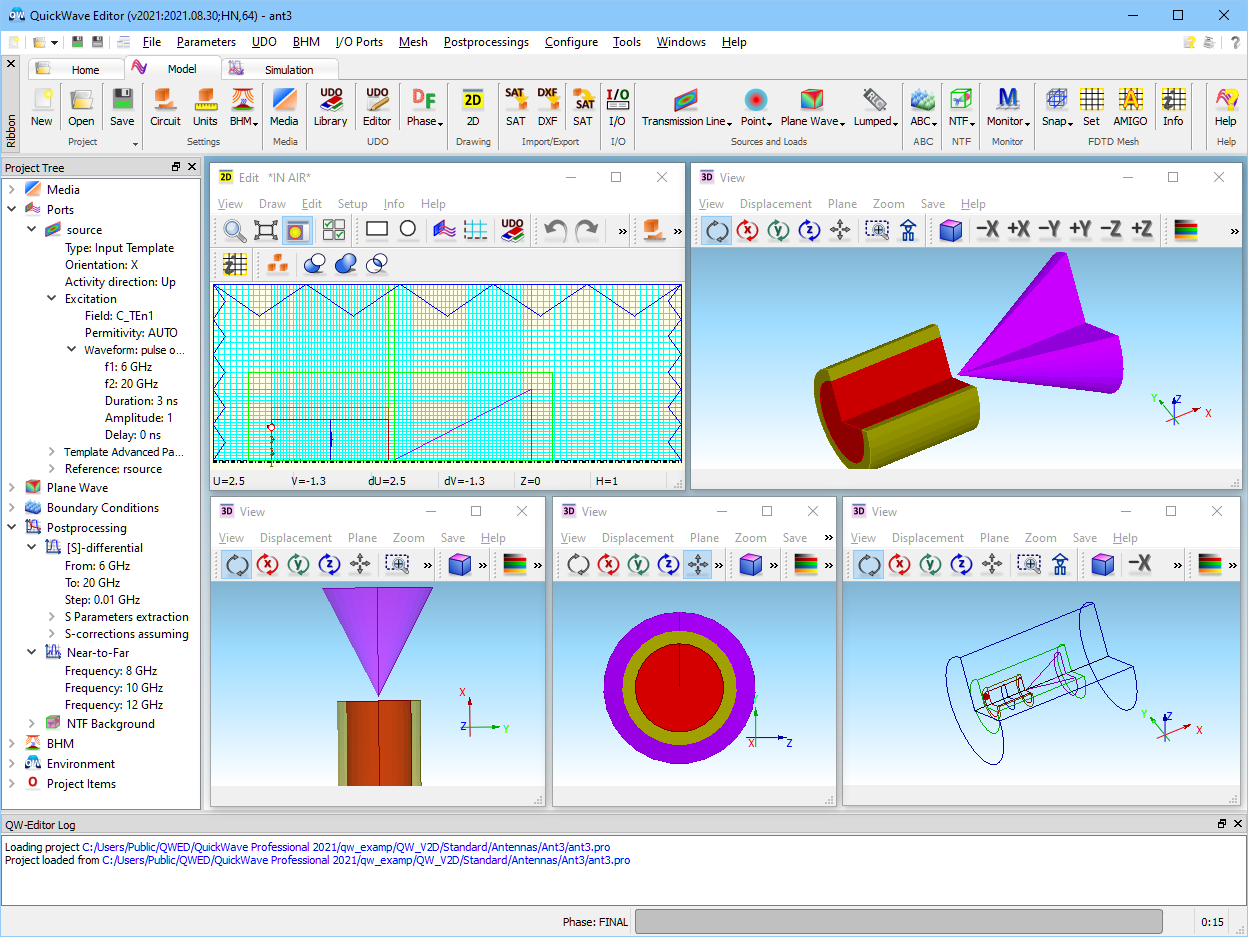
Fig. 2.2-1 A view of the ant3.pro example in QW-Editor.
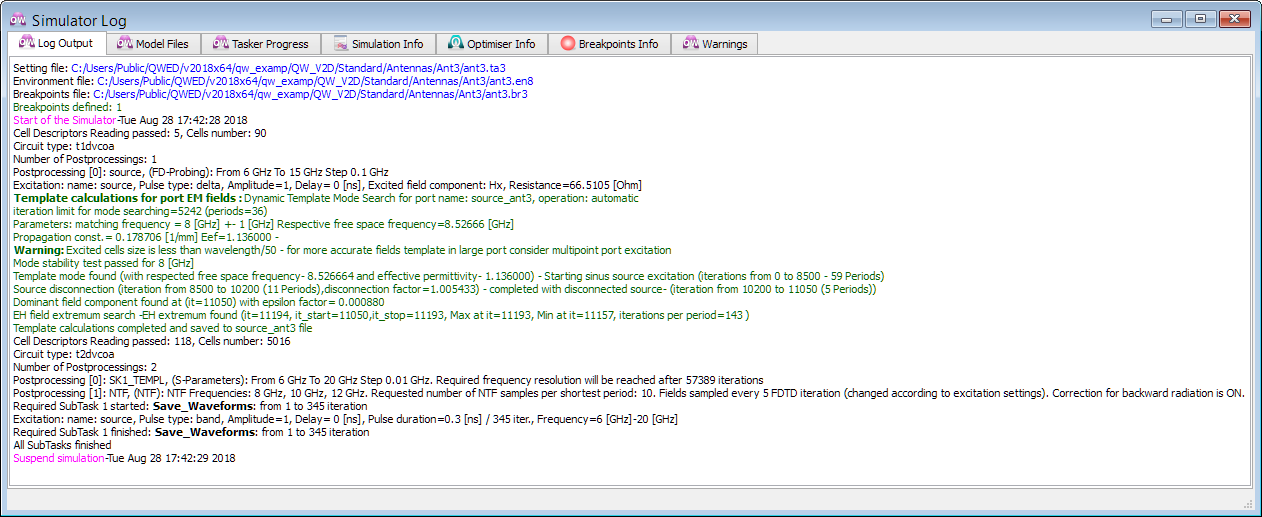
Fig. 2.2-2 Simulator Log of QW-Simulator for ant3 example.
Fig.V2D 2.2-3 Return loss of the ant3 example after 6000 iterations.
Pressing ![]() button in the Results tab invokes the Radiation Patterns dialogue as on the left of Fig. 2.2-4. It shows the settings for ant3 example. Accepting the proposed settings (OK button) brings up the Results window for 2D radiation pattern (NTF post-processing results), with both Etheta and Ephi patterns at the second NTF frequency of 10 GHz in decibel scale.
button in the Results tab invokes the Radiation Patterns dialogue as on the left of Fig. 2.2-4. It shows the settings for ant3 example. Accepting the proposed settings (OK button) brings up the Results window for 2D radiation pattern (NTF post-processing results), with both Etheta and Ephi patterns at the second NTF frequency of 10 GHz in decibel scale.
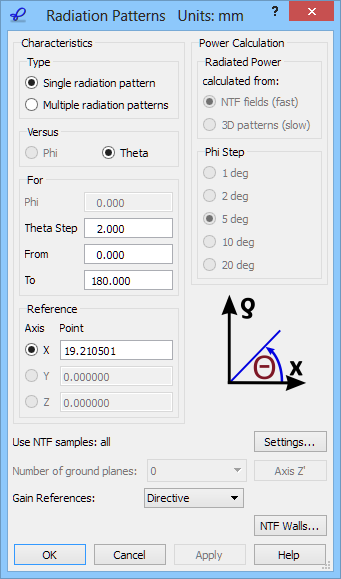
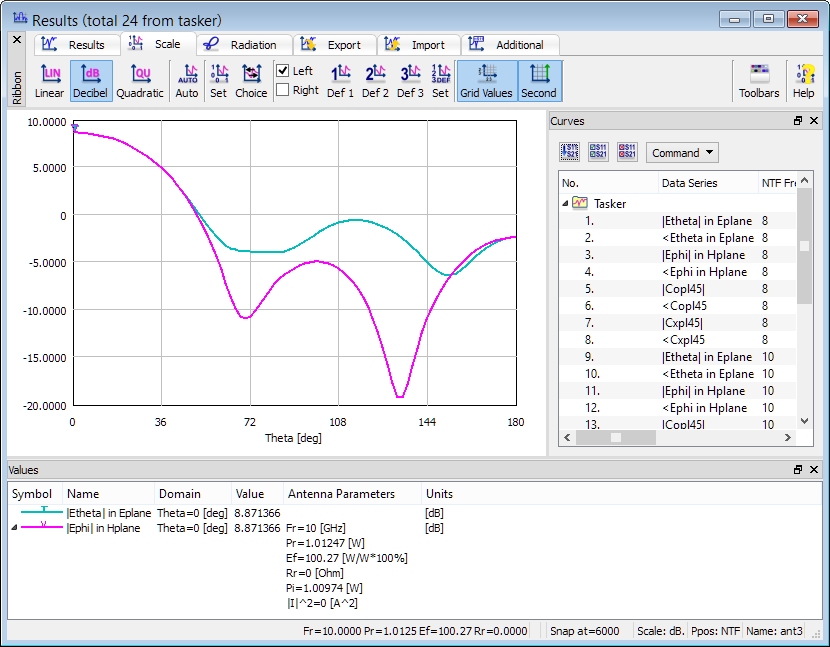
Fig. 2.2-4 Radiation patterns of the ant3 example at 10 GHz.