15.8Antenna Array postprocessing
In QuickWave EM simulator user can create set of NTF (Near To Far Fields transformation) binary files for use in new Antenna Array postprocessing to speedup Antenna Array radiation pattern calculations for arbitrary antenna excitation amplitude and delay distribution.
Up to version 2023 of the QuickWave simulator user could calculate antenna array with arbitrary excitation distribution by performing full FDTD simulation for each excitation distribution set. Usually such approach was time consuming and not flexible. In version 2024 user can calculate NTF transformation box for each antenna of antenna array for defined excitation (usually for normalized excitation signal amplitude and delay) in one FDTD simulation calculations saving appropriate NTF Fourier components in binary file for later usage to calculate antenna array radiation pattern for arbitrary excitation schema.
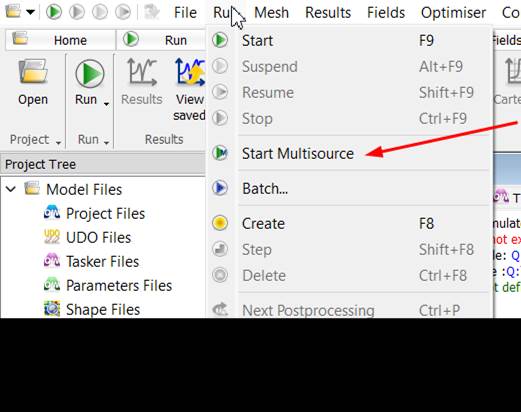
There is special running mode of the QuickWave FDTD simulator available from Run menu called “Start Multisource”:
This mode is available only for multisource models which is standard situation for Antenna Array models. User can find QuickWave Modeller Antenna Array example typically in the …\examples\QW-3D\Standard\Antennas\AntennaArray directory.
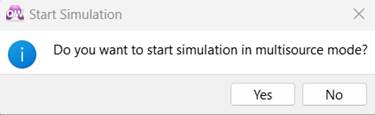
Running simulator in this mode from Run menu required confirmation as well as simulator required to run with Energetic Stop Criteria to stop simulation for each source when stop criteria is fullfilled. Typical simulation log for “Multisource simulation mode” is as follows:
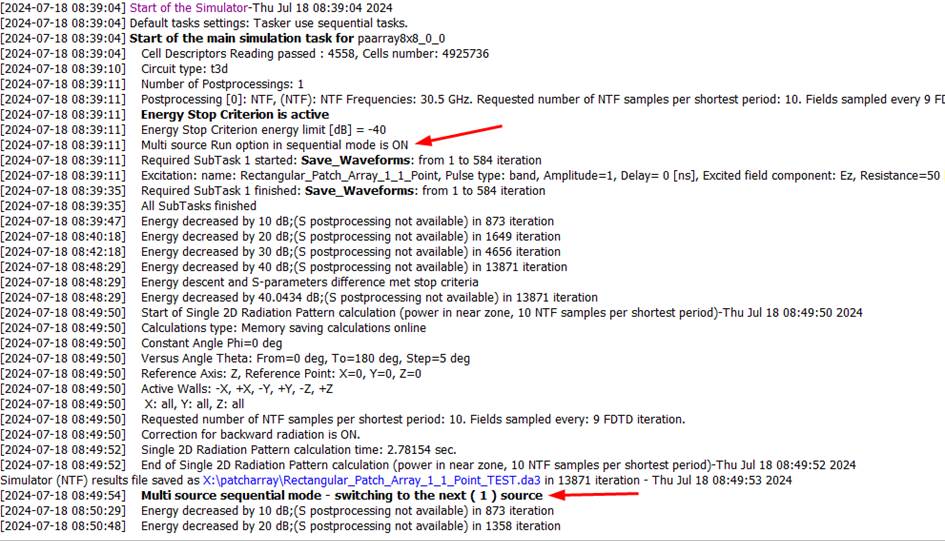
During “Multi Source” simulation mode, simulator perform as much FDTD simulations as number of sources, saving *.NTFb3 binary files of NTF Fourier components for each source sequentially. Binary files names are set as name of excitation name with NTFb3 extension (e.g. Rectangular_Patch_Array_i_j_Point.NTFb3 where i,j are indices of excitation in paarray8x8_0_0.QWpro model). Having set of *.NTFb3 binary files for each source user can calculate Radiation Pattern of Antenna Array for arbitrary set of amplitudes and delays.
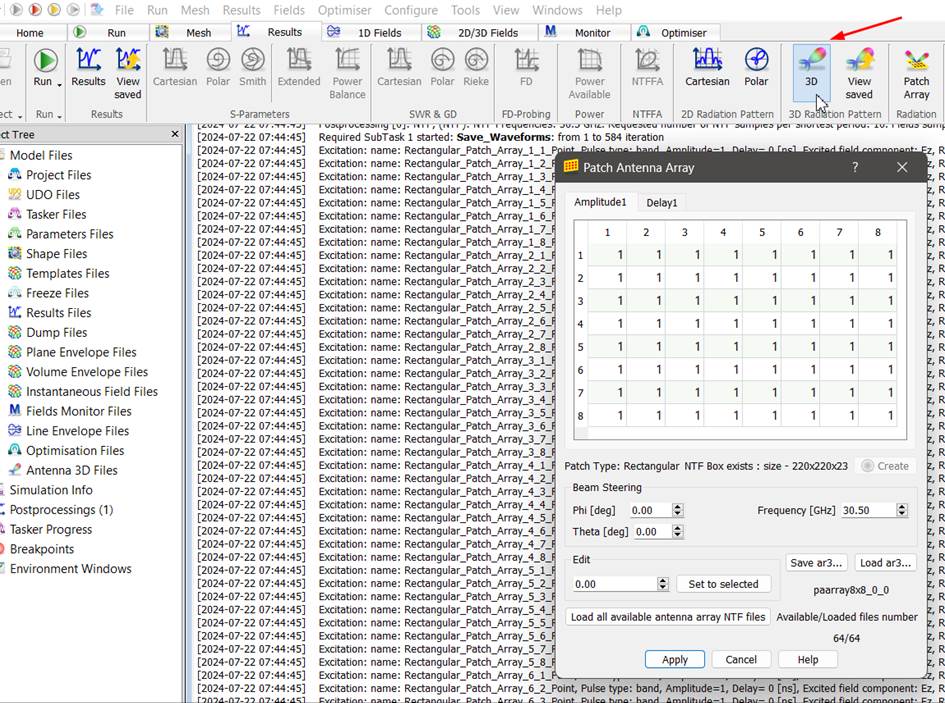
To do this user can open Patch Array Radiation Pattern dialog
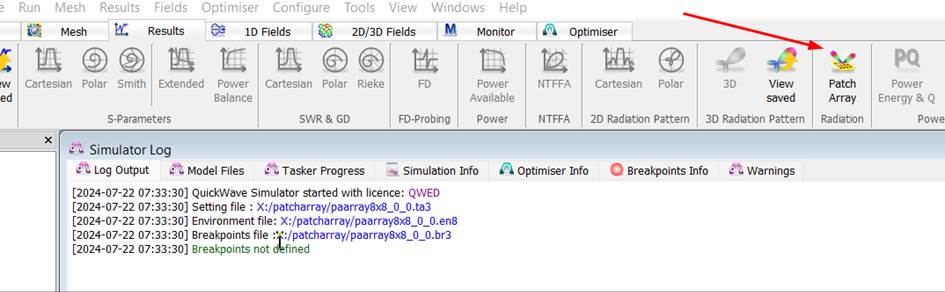
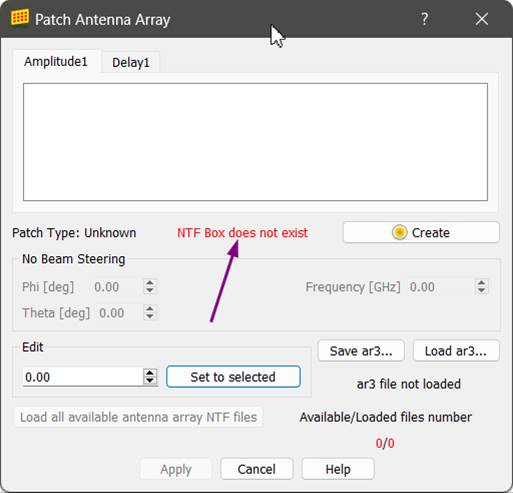
Opening dialog Patch Array Radiation Pattern dialog while QuickWave simulator is in idle state (not run/create model state) red color warning “NTF Box does not exist” appears.
This warning inform that calculation of radiation pattern is not available in this simulator state. User has to at least create NTF Box for earlier selected model by File->Open.
Pressing „Create” in the dialog user can obtain such log result:
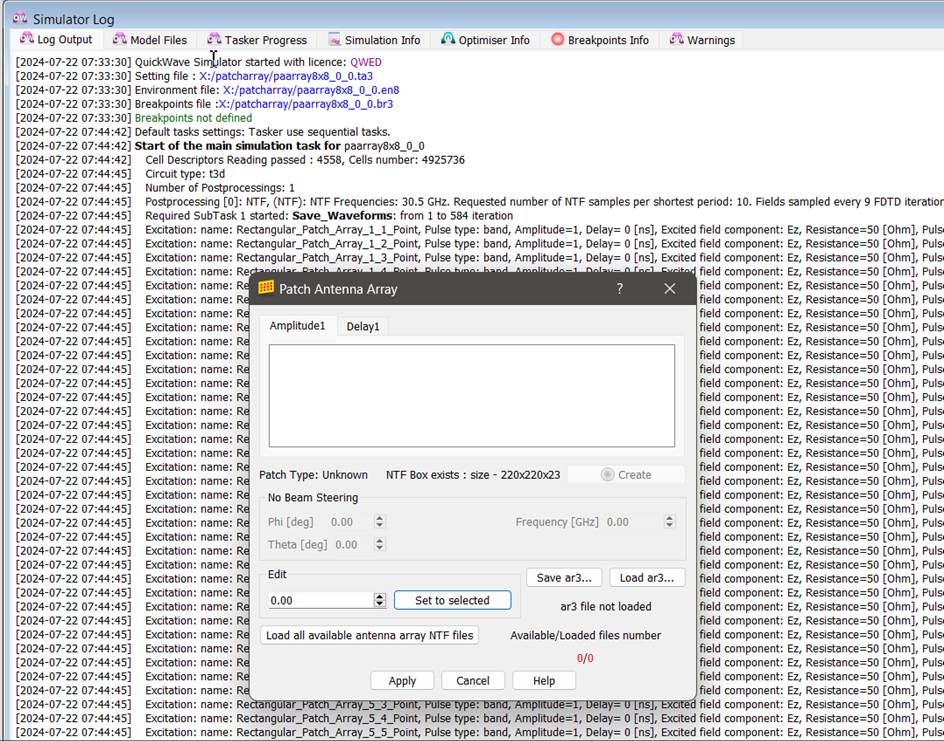
This „Create” button is the same action as Run->Create and is placed in the dialog for convinience.
In the Simulation log user can see list for model excitations.
In the dialog instead of NTF warning information about NTF Box size expressed in FDTD cells number is displaying e.g. 220x220x23.
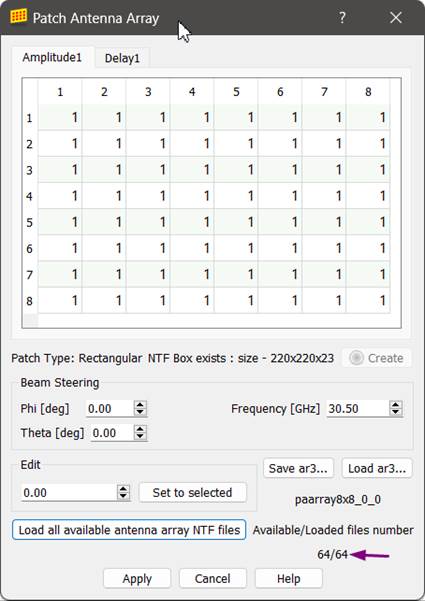
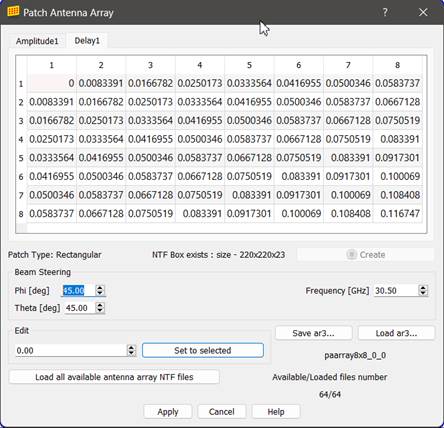
To start calculate radiation pattern there is necessary to define Patch Type by loading corresponding to the model *.ar3 text file which was created during Antenna Array model definition by QuickWave Modeller. After paarray8x8_0_0.ar3 file load dialog is as follows:
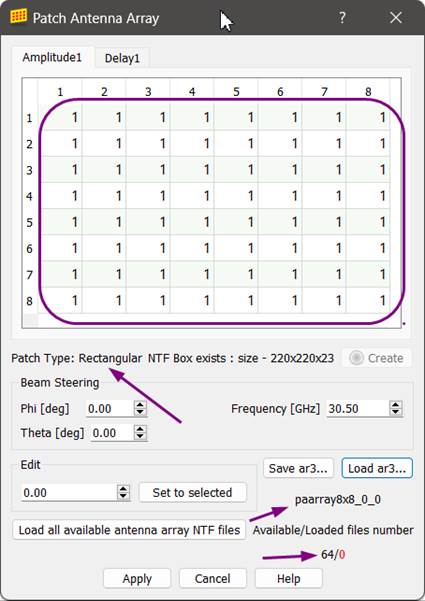
Now Patch Type is displayed as Rectangular, *.ar3 base file name is displyed as paarray8x8_0_0, number of available *.NTF3b files is displayed as 64 which coresponds number of excitation sources. 0 displayed in red color after “64/” means that NTF3b files are not loaded. User can load them by pressing “Load all available array NTF files”.
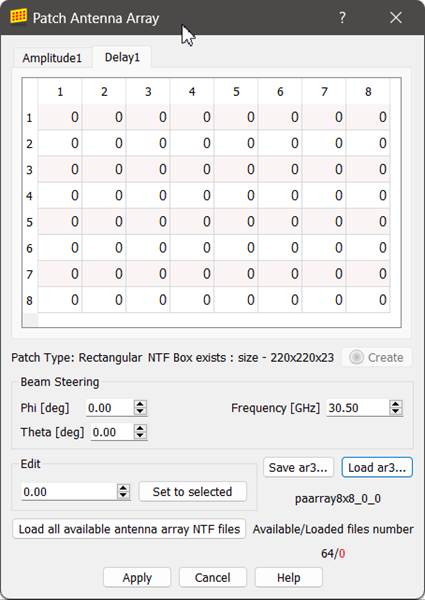
Amplitude1 and Delay1 tabs now shows amplitude and delay distribution for Antenna Array excitations taken from loaded paarray8x8_0_0.ar3 file.
Pressing “Load all available array NTF files” changing dialog and Simulation log:

In this state User can calculate Antenna Array Radiation Pattern for current set of amplitudes and delays by pressing apply. To see the Antenna Array Radiation Pattern User should use 3D Radiation Pattern window which is also available when simulation model was created calculated radiation pattern data however will be available after pressing “Apply” button in “Patch Antenna Array” dialog. 3D radiation pattern window can be opened with no radiation pattern because NTF box data initially have “0” Fouriers data.
After ealier preliminary procedure which contains:
Opening Antenna Array Model
Creation of the NTF boxes binary files for set of sources in Multisource Run QW simulator mode (usually this is time consuming FDTD simulation procedure)
Opening Patch Array dialog
Creation of the model by pressing Create button in the dialog (is grey if model was created earlier)
Loading appropriate *.ar3 file using “Load ar3…”
Loading all available antenna array NTF files
User can perform main Radiation Pattern calculation actions using “Patch Antenna Array” dialog.
Those actions includes:
Manual settings od amplitude and/or delay distribution for each of the excitation sources for the antenna array
Automatically setting of delay distribution for chosen Phi and Theta beam
Block settings for selected cells of amplitude and/or delay
Using shortcuts CTRL+1 or CTRL+0 to set value of 1 or 0 for selected amplitude and/or delay cells
Such actions are similar to actions performed in wide used spreadsheets.
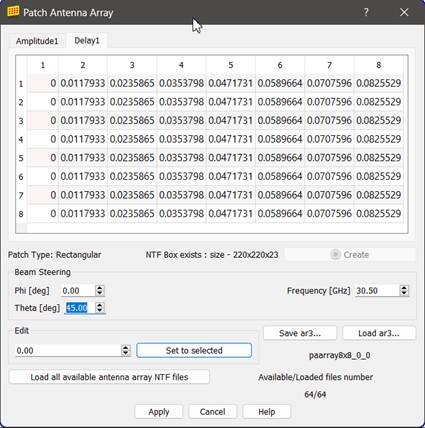
For example after setting Theta=45 deg leaving Phi=0 (left), setting Phi=45 deg (right) and pressing Enter for setting confirmation delay table for considered example is:
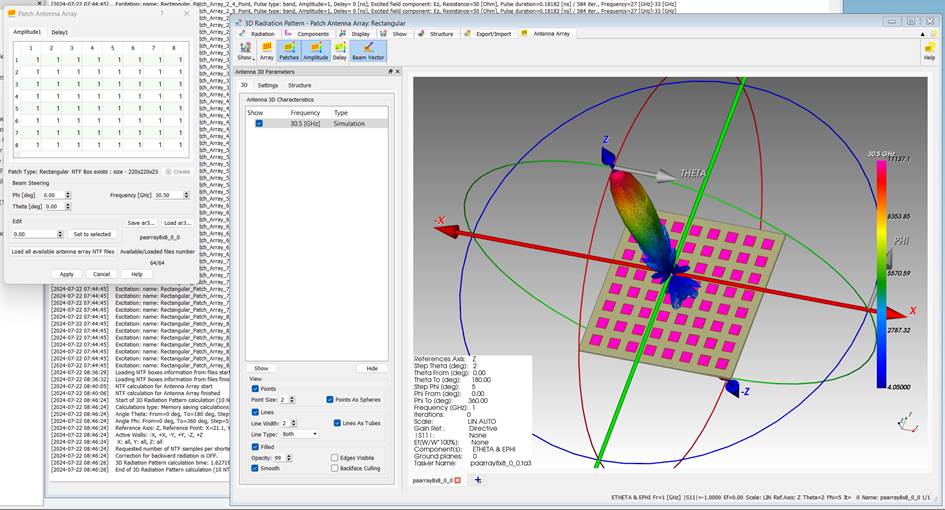
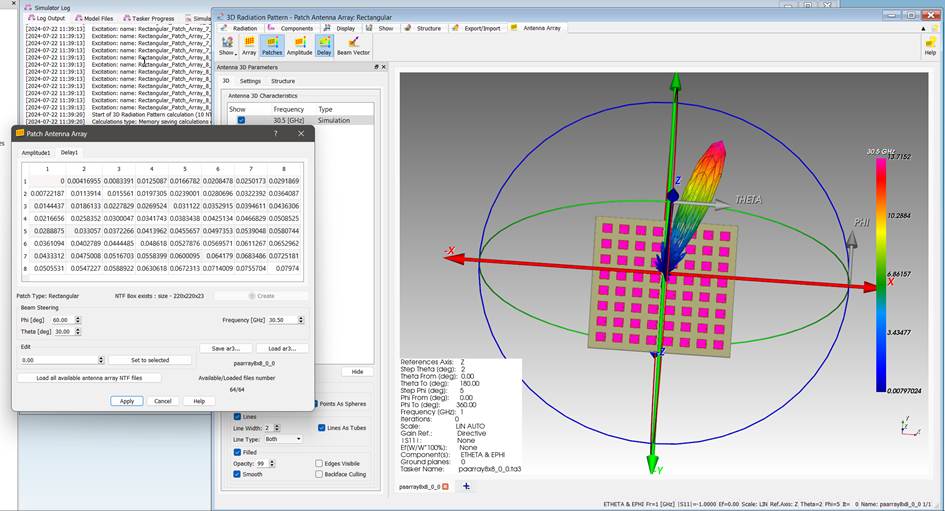
Calculation of Radiation Pattern for arbitrary Theta, Phi or any other distribution of amplitudes and delays not required FDTD simulation but only fast (takes seconds – depends on model size) postprocessing calculations. For Phi=60 deg and Theta=30 deg User can obtain following radiation pattern:
Sets of amplitude and delay distribution can be saved in the ar3 files by “Save ar3…”.